
How to Measure Product-Market Fit: Signals, Surveys and Metrics
To measure product market fit, combine one survey (the share of users who would be very disappointed to lose your product) with a retention curve that flattens and organic growth you did not pay for. This guide shows each signal and a one-month scorecard.
By Founders360 Team
To measure product market fit, run three tests side by side: a survey asking users how disappointed they would be to lose your product, a retention curve that flattens instead of falling to zero, and growth that comes from word of mouth rather than paid effort. No single number proves it, but when all three agree you can trust the answer.
How do you measure product-market fit with the Sean Ellis survey?
Send one question to people who have actually used the product: "How would you feel if you could no longer use this product?" with the answers very disappointed, somewhat disappointed, and not disappointed. If at least 40 percent say very disappointed, you have an early sign of product-market fit.
The threshold has a documented origin. First Round Review reports that Sean Ellis, who led early growth at Dropbox, LogMeIn and Eventbrite, benchmarked nearly a hundred startups and found that companies struggling for traction almost always scored under 40 percent, while companies with strong traction almost always scored above it. Treat it as a rule of thumb, not a law. A score of 38 percent does not mean failure and 41 percent does not mean you are done.
Three practical rules make the survey honest:
- Ask the right people. Survey users who used the product at least twice in the last two weeks, not everyone who signed up. The same First Round article describes Superhuman doing exactly this.
- Wait for enough answers. The article notes that directionally useful results can appear at around 40 respondents. Below that, one cheerful user swings the score.
- Add the follow-up questions. Ask who would benefit most, what the main benefit is, and how you could improve the product. The score tells you where you are; the open answers tell you what to change.
The same article gives a useful reference point. Superhuman first scored 22 percent. Segmenting the same answers to focus on the users who said very disappointed raised it to 33 percent before any product change, and within three quarters of product work it reached 58 percent. A low first score is a starting line, not a verdict.
What does a retention curve say about product-market fit?
A retention curve that flattens at a level above zero says your product keeps a core group of users. A curve that keeps sliding toward zero says people try the product, find it unnecessary, and leave, however good the signup numbers look.
Build a retention cohort table: group users by the week they first used the product, then track what share still use it in week one, week two, week four and week eight. You are not looking for a particular percentage. Healthy levels differ widely between a daily tool, a monthly invoicing product and a yearly compliance product. You are looking for the shape: each cohort drops, then levels off.
If you are pre-launch or have fewer than 30 users, a cohort table will be noisy. Use it anyway, because the early shape tells you whether to keep acquiring users or fix the product first. Pouring new users into a leaking bucket only hides the leak. If you have not yet found those first users, start with how to find your first 10 customers for a B2B startup.
Which organic growth and referral signals matter?
The signals that matter are the ones you did not buy or push: users who invite colleagues, customers who come back unprompted, and new leads who say a friend sent them. Marc Andreessen describes the contrast in The Pmarca Guide to Startups: without fit, word of mouth does not spread and the sales cycle drags; with fit, customers buy or use the product about as fast as you can supply it.
Track these four, all countable by hand in a spreadsheet:
- Referral share. Of the last 20 new users or leads, how many arrived through a referral or a direct mention?
- Unprompted reorders or renewals. How many customers returned without you chasing them?
- Expansion inside accounts. For B2B, do more teammates start using it after the first one?
- Inbound questions. Are strangers asking for access, pricing or a demo?
What qualitative signals show you have product-market fit?
The clearest qualitative signal is customers who would be upset to lose the product and can explain why in their own words. Ask five to ten active users on a call: "What would you use if this disappeared tomorrow?" and "What did you do before?" Strong answers are specific, name a painful alternative, and come without prompting.
Listen for the opposite as well. Polite praise, feature wishlists that point in five directions, and users who cannot describe the problem you solve all suggest weak fit. Check whether your best users look alike. If the people who love the product share an industry, a role and a trigger event, you have found your customer, and writing that down as an ideal customer profile lets you aim every later test at them.
What product-market fit is not
Product-market fit is not revenue, a waitlist, a launch spike, or investor interest. Each can happen without it.
- Early revenue can come from friends, founder hustle or heavy discounts. Revenue that survives without your constant selling is closer to fit.
- A waitlist measures curiosity. It says nothing about repeat use.
- Growth bought with ads can mask a leaking product. Check payback before celebrating; the guide to unit economics for early-stage startups explains how.
- One enthusiastic customer is a lead, not a market.
A one-month product-market fit scorecard for pre-seed founders
You can score yourself in four weeks with a spreadsheet and a survey form. This is an illustrative scorecard, not an industry standard: the thresholds are starting points to adjust for your product.
| Week | Task | Pass signal (illustrative) | |---|---|---| | 1 | Define your active user and the action that counts as retained. List everyone who qualifies. | A written definition and a user list | | 2 | Send the four-question survey to active users. Aim for at least 40 answers if you have them. | Very disappointed share at or above 40 percent | | 3 | Build the cohort table and call five to ten active users. | Curve levels off; callers name a painful alternative | | 4 | Count referrals, reorders and inbound requests; write up the result. | Most new leads arrive without you chasing them |
Score one point per row that passes. Four points suggests you can start scaling the channel that works, as laid out in the 90-day go-to-market plan for a pre-seed startup. Two or three points means you are close: pick the weakest row and fix that before adding spend. One point or fewer means go back to customer conversations and narrow your segment.

How Founders360 helps you plan the tests
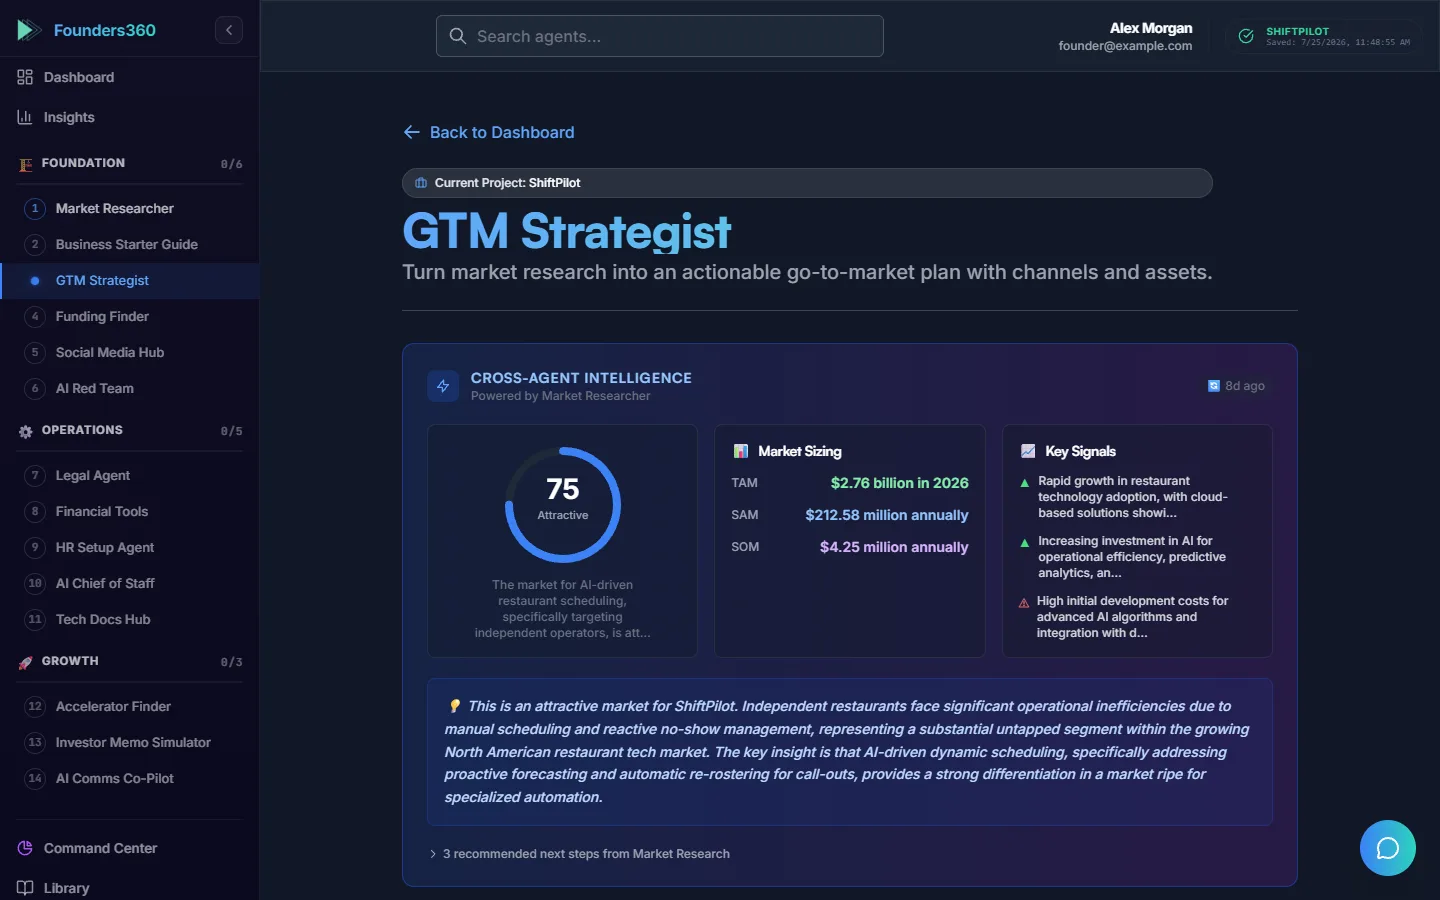
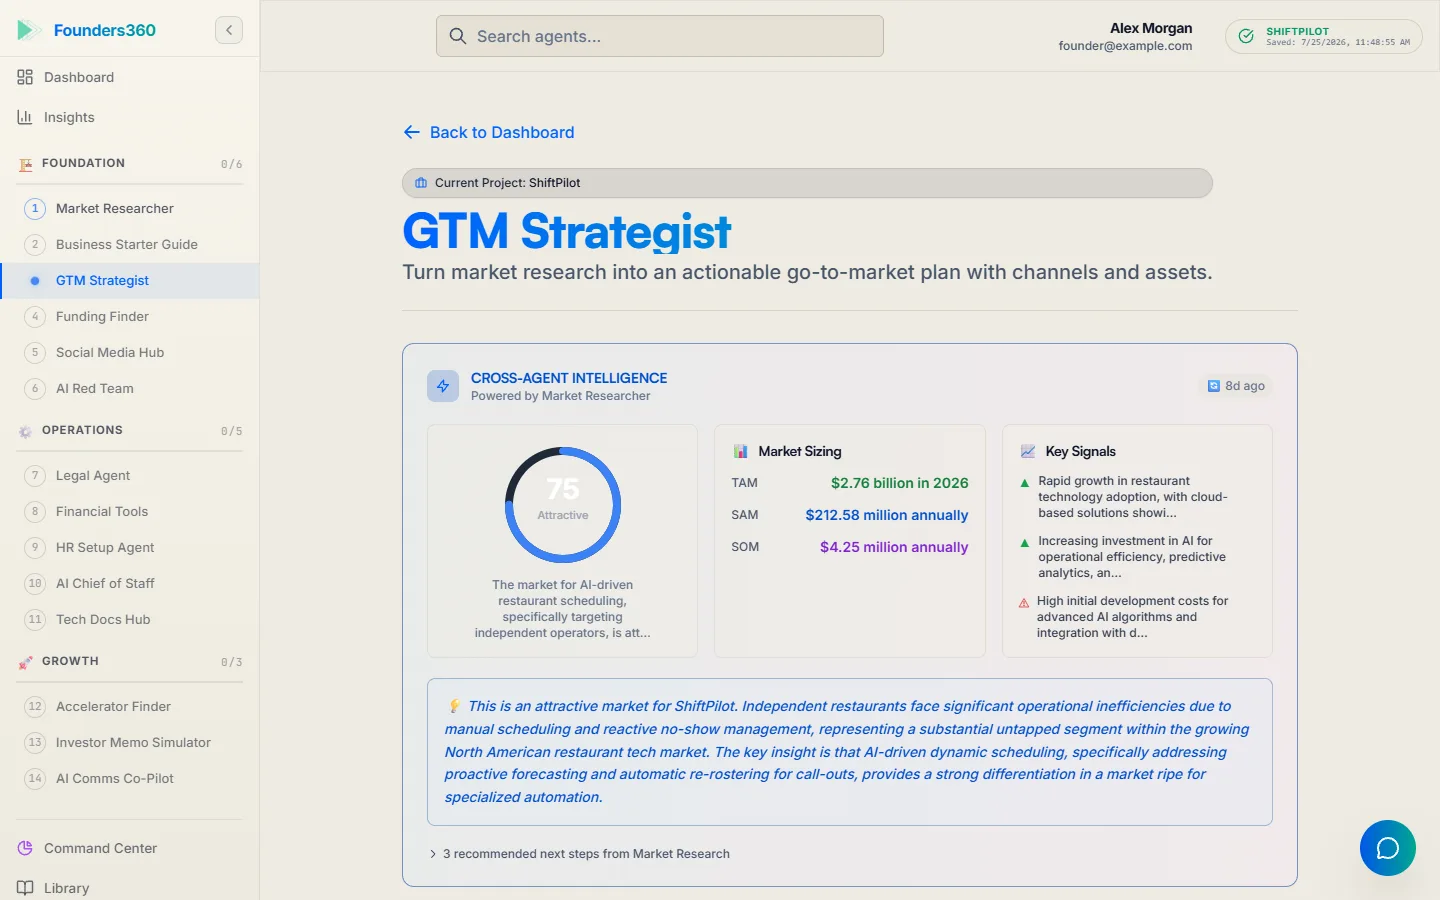
The GTM Strategist is one of the five agents that are free forever, and it can help you turn the scorecard into a plan: who to survey, which segment to focus on, and which channel to test first. Because agents share one company memory, called Shared Context, what you record about your customer there is available to the other agents later.
Try it free at https://www.founders360.world.
Frequently Asked Questions
What is a good product-market fit score?
A common benchmark is 40 percent or more of surveyed users saying they would be very disappointed without your product. Sean Ellis found that struggling startups almost always fell below it. It is a rule of thumb, so pair it with retention and referral data.
How many users do I need for the survey?
Around 40 responses from active users is the figure First Round Review cites for directionally useful results. With fewer, treat the number as a hint and rely more on customer calls.
How is product-market fit different from retention?
Retention is one input. Product-market fit combines retention with a strong reaction from users and demand that grows without heavy effort. A flat retention curve with no growth means a small group loves it, which may still be a niche.
How long does it take to find product-market fit?
There is no reliable timeline. According to First Round Review, Superhuman moved from a segmented score of 33 percent to 58 percent within three quarters of focused product work. Expect several rounds of survey, change and re-survey.
Can I measure product-market fit before I have revenue?
Yes. The survey, the retention cohorts and customer calls all work with unpaid users. What you need is real usage, not payment, so a free beta can give a meaningful answer.
Tags
Ready to Build Smarter?
Join thousands of solopreneurs using AI agents to scale their businesses.
Get Started Free