
How to Value a Pre-Revenue Startup: 5 Methods Investors Actually Use
A pre-revenue valuation is mostly a negotiated number, but investors anchor on five repeatable methods. Here is how each one works, what actually moves the price, and the mistakes that cost founders the round.
By Founders360 Team
To value a pre-revenue startup, you combine two or three rough methods (Berkus, scorecard, risk factor summation, the venture capital method, and market comparables), then accept that the final number is negotiated between you and the investors who want in. No formula can price a company with no revenue, because the inputs are guesses about the future. The methods exist to give both sides a defensible range to argue about.
This guide walks through each method, shows an illustrative example, explains how a SAFE valuation cap connects to all of it, and covers what really moves the number.
Is pre-revenue valuation science or negotiation?
It is mostly negotiation, with arithmetic wrapped around it. With no revenue, no cash flow and often no product in market, there is nothing to discount or multiply. What you have is a story, a team, a market and some early signals.
Investors know this. Dave Berkus, who created one of the best known methods below, has said his own fixed matrix should be treated as a suggestion rather than a rigid form, according to Gust. Gust also notes that best practice for angels investing in pre-revenue companies is to use several methods together.
So the goal is not to find the "correct" valuation. The goal is to arrive at a range you can explain in two minutes, backed by evidence, so the conversation is about the range and not about whether you have thought about it.
What is the Berkus method?
The Berkus method assigns up to $500,000 to each of five factors, so a perfect score tops out at $2.5 million pre-money. It is the simplest method and works best for very early companies.
The factors, as described by Gust, are:
- A sound idea (basic value)
- A working prototype (reduces technology risk)
- A quality management team (reduces execution risk)
- A quality board or strategic relationships (reduces market risk)
- Product rollout or sales (reduces production and financial risk)
Sources differ slightly on the fourth factor, which is why you will see both names. You score each factor from zero to $500,000 and add them up.
The weakness is that it ignores market size and competition, and it caps out low for markets where seed rounds routinely price far above $2.5 million. Treat it as a floor check for the earliest stage, not as a final answer.
How does the scorecard (Bill Payne) method work?
The scorecard method starts from the median pre-money valuation of comparable funded startups in your region and stage, then adjusts it up or down based on how you compare. Angel investor Bill Payne described it in his 2006 book, The Definitive Guide to Raising Money From Angels.
Each factor has a weight, and you score yourself against the average comparable company, where 100% means average. A commonly cited weighting is:
- Strength of the team: 30%
- Size of the opportunity: 25%
- Product or technology: 15%
- Competitive environment: 10%
- Marketing, sales and partnerships: 10%
- Need for additional investment: 10%
Sources vary on the lower weights, so confirm the version your investor uses. You multiply each weight by your relative score, add the results, and multiply the total by the regional median.
Illustrative example (invented numbers, not market data). Assume the median pre-money for comparable seed deals in your region is $3 million. You score your team at 125%, opportunity 100%, product 90%, competition 80%, and marketing and funding need each 100%. The weighted sum is 37.5 + 25 + 13.5 + 8 + 10 + 10 = 104%. That implies about $3.12 million pre-money. The output is only as good as the median you start from, so use a real comparable set.
What is the risk factor summation method?
The risk factor summation method starts from an average regional pre-money valuation and adjusts it across twelve risk categories, adding or subtracting value for each. Payne credits the approach to Ohio TechAngels on Gust.
The twelve categories typically include management, stage of the business, legislation or political risk, manufacturing, sales and marketing, funding, competition, technology, litigation, international, reputation, and the potential for a lucrative exit. One commonly published version rates each from minus two to plus two, with each step worth $250,000. A plus two on management adds $500,000, and a minus one on competition subtracts $250,000.
This method is useful because it forces you to name risks you would rather skip. Payne notes it works better alongside other methods than alone.
How does the venture capital method price a pre-revenue startup?
The venture capital method works backward from a target exit and the return an investor needs. It is the method most institutional investors quietly use, because it reflects how their funds actually work.
The steps:
- Estimate a plausible exit value in five to seven years.
- Pick the return multiple the investor needs (for example 10x for a risky early bet).
- Divide the investment by that multiple's share of the exit to find the ownership needed at exit.
- Adjust for dilution from future rounds to find ownership needed today.
- Divide the investment by that ownership to get post-money, then subtract the investment for pre-money.
Illustrative example (invented numbers). An investor puts in $1 million and wants 10x, so they need $10 million back. If the exit is $50 million, they need 20% at exit. If later rounds will dilute them by 30%, they keep 70% of their stake, so they need about 28.6% today. That gives a post-money of roughly $3.5 million and a pre-money of roughly $2.5 million.
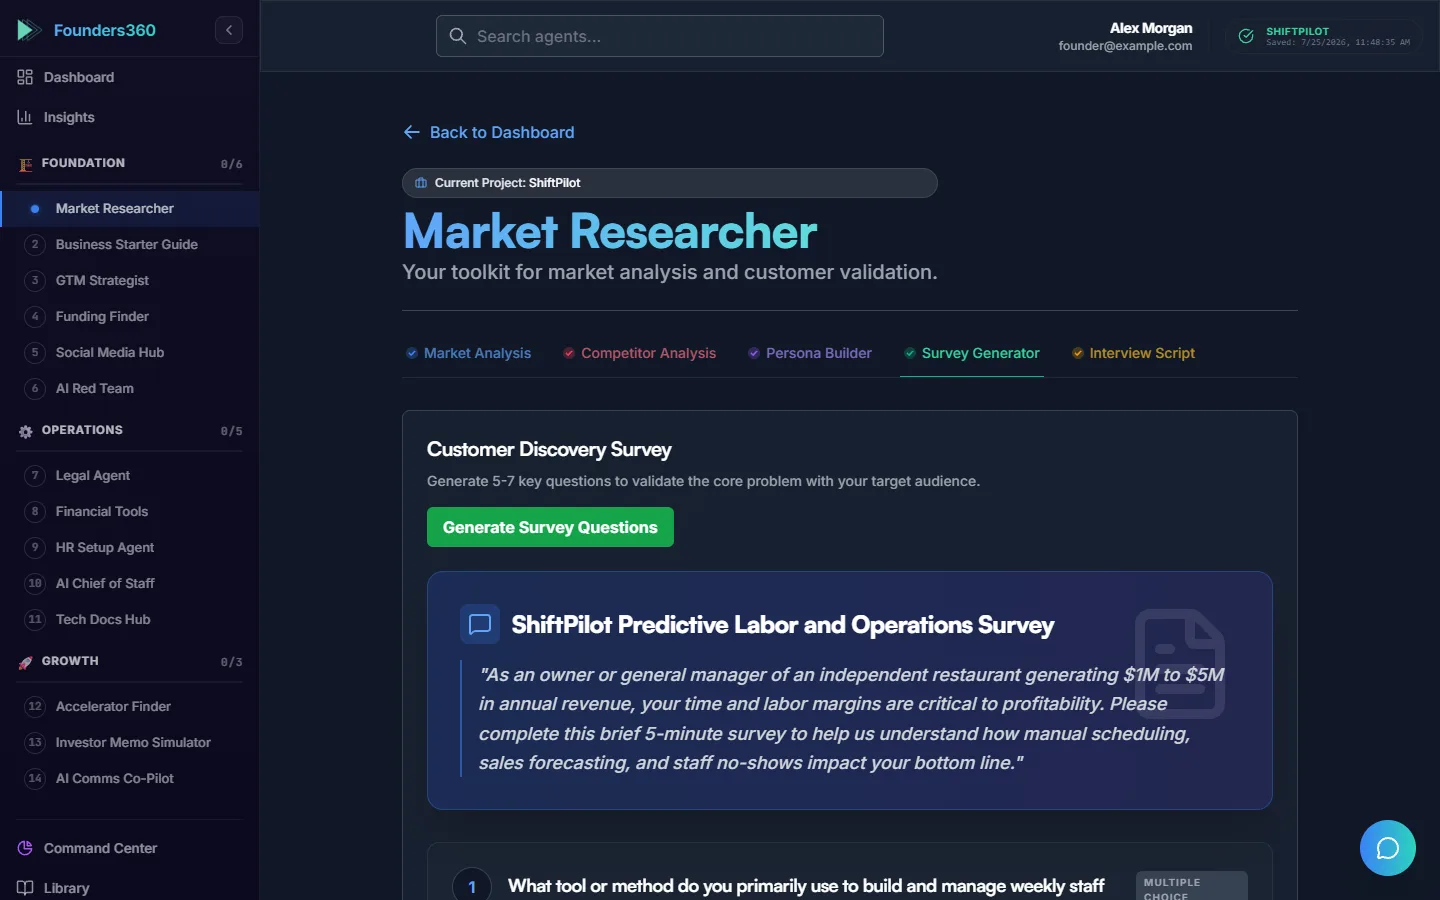
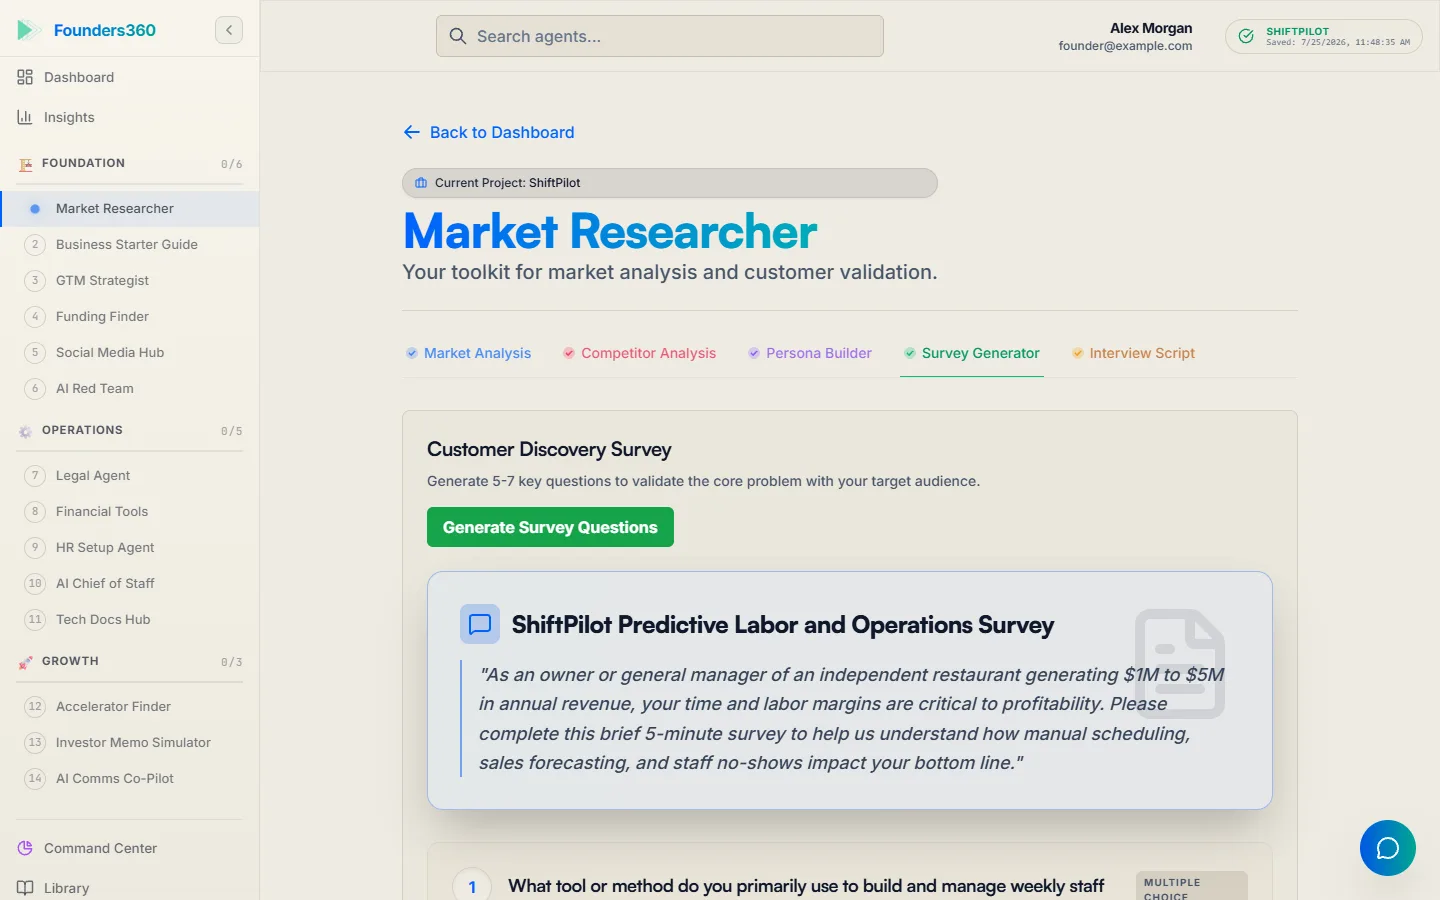
Notice what drives the result: the exit assumption. Change $50 million to $200 million and the same investor accepts a much lower ownership share. This is why market size evidence matters so much. Founders360's Market Researcher agent, which is free to start, builds an evidence-based TAM, SAM and SOM so your exit story rests on sourced figures. Our TAM SAM SOM guide explains the method.
Can market comparables and published data set your valuation?
Comparables are the closest thing to a market price, and they are what most investors check first. The catch is that headline medians mix sectors, rounds and years, so use them as a range, not a target.
Carta publishes data on SAFE valuation caps from its customer base. According to Carta's State of Pre-Seed 2025 review, median post-money SAFE valuation caps hovered around $10 million for rounds between $250,000 and $1 million, and around $15 million for rounds between $1 million and $2.5 million. Carta's Q2 2026 analysis reports that valuation caps on new SAFEs keep rising, with the median cap on SAFEs larger than $2.5 million at $35 million, up 40% year over year. These figures describe Carta's own customer data and skew toward venture-backed companies, so a founder in a small market or a non-venture business should expect different numbers. Check Carta's current reports before quoting anything to an investor, because the figures change every quarter.
Use comparables to sanity check the methods above. If your scorecard output is $3 million and the market for your stage and sector clusters near $10 million, ask which is wrong and why.
How does a SAFE valuation cap relate to valuation?
A valuation cap on a SAFE is the maximum valuation at which the investment converts to equity, so it works as a negotiated proxy for your valuation without setting one formally. On a post-money SAFE, the investor's ownership is roughly the investment divided by the cap, measured before the new money in the priced round.
Example (illustrative): an $800,000 investment on an $8 million post-money cap gives the investor about 10% at conversion. Because SAFEs do not set a price today, many pre-seed rounds use caps instead of priced equity. The cap still anchors the conversation, and a cap that is too high or low has real consequences for dilution. Our guide to SAFE cap dilution at pre-seed shows how stacked SAFEs affect your ownership.
What actually moves the number, and what mistakes cost founders?
Four things move a pre-revenue valuation most: team, traction signals, market size evidence, and competition for the round.
- Team. Prior experience in the space, a complete founding team and relevant technical depth carry the heaviest weight in both the Berkus and scorecard methods.
- Traction signals. Waitlists, letters of intent, paid pilots, design partners and early usage count as proof. Our guide to financial projections with no revenue shows how to turn them into a credible model. Financial Tools in Founders360 can help you build those projections.
- Market size evidence. A sourced bottom-up market beats a one-line "1% of a huge market" claim.
- Competition for the round. Two investors who both want in will move a valuation more than any method. A single lukewarm investor will not.
The common mistakes:
- Anchoring too high. An aggressive number can stall a round or force a down round later. If investors pass over a price, you will rarely hear that the price was the reason.
- Optimising price over terms. A slightly lower valuation with clean terms often beats a high valuation with heavy liquidation preferences, pro-rata demands or stacked SAFEs.
- Using one method. A single method is easy to attack. Two or three that roughly agree are hard to dismiss.
- Ignoring the investor's side. Founders rarely see their round through the investor's spreadsheet.
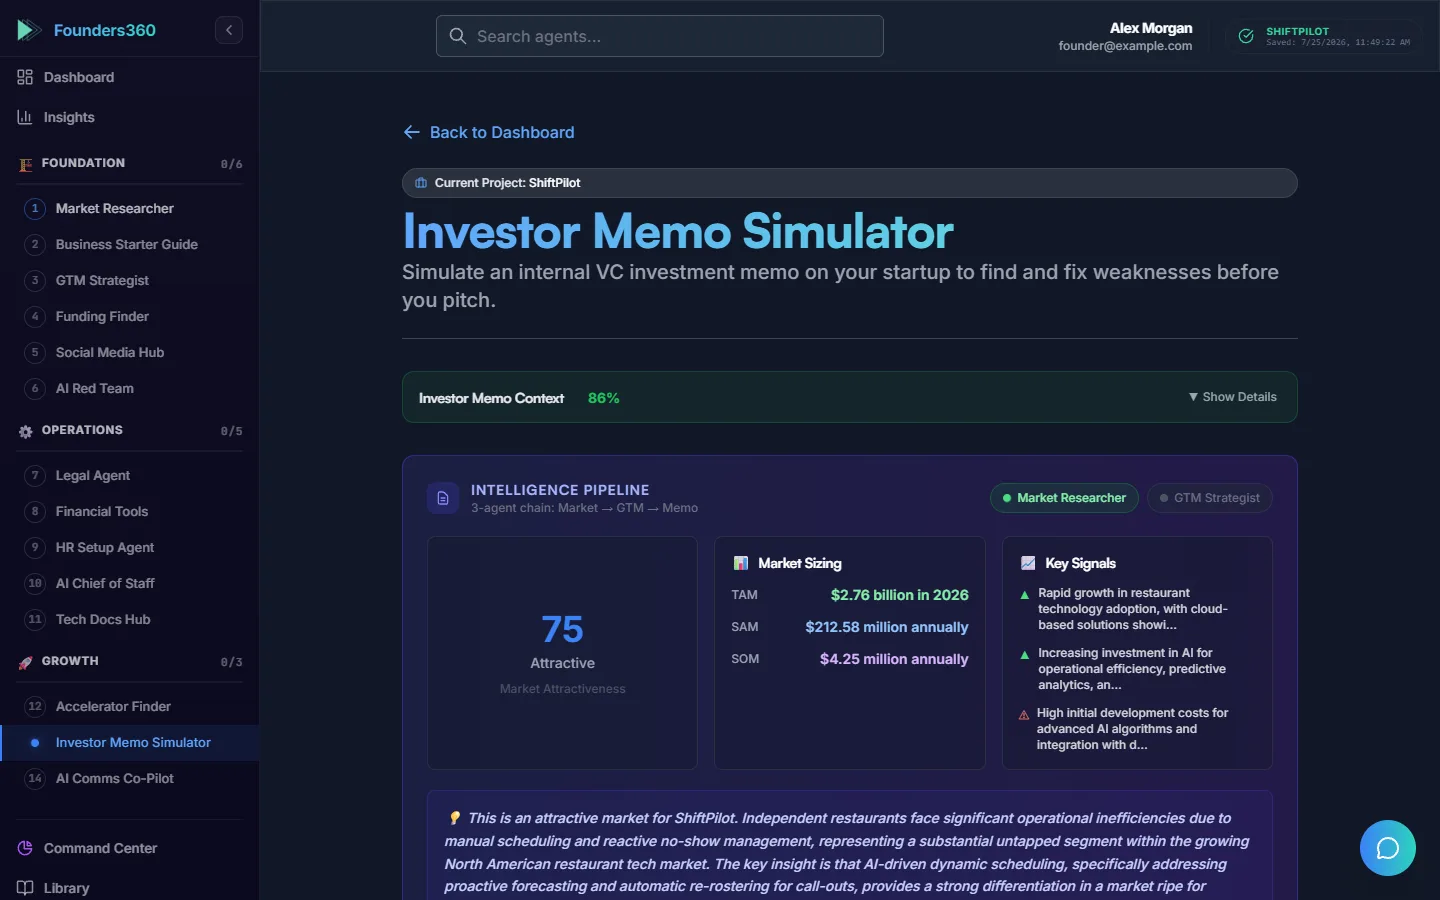
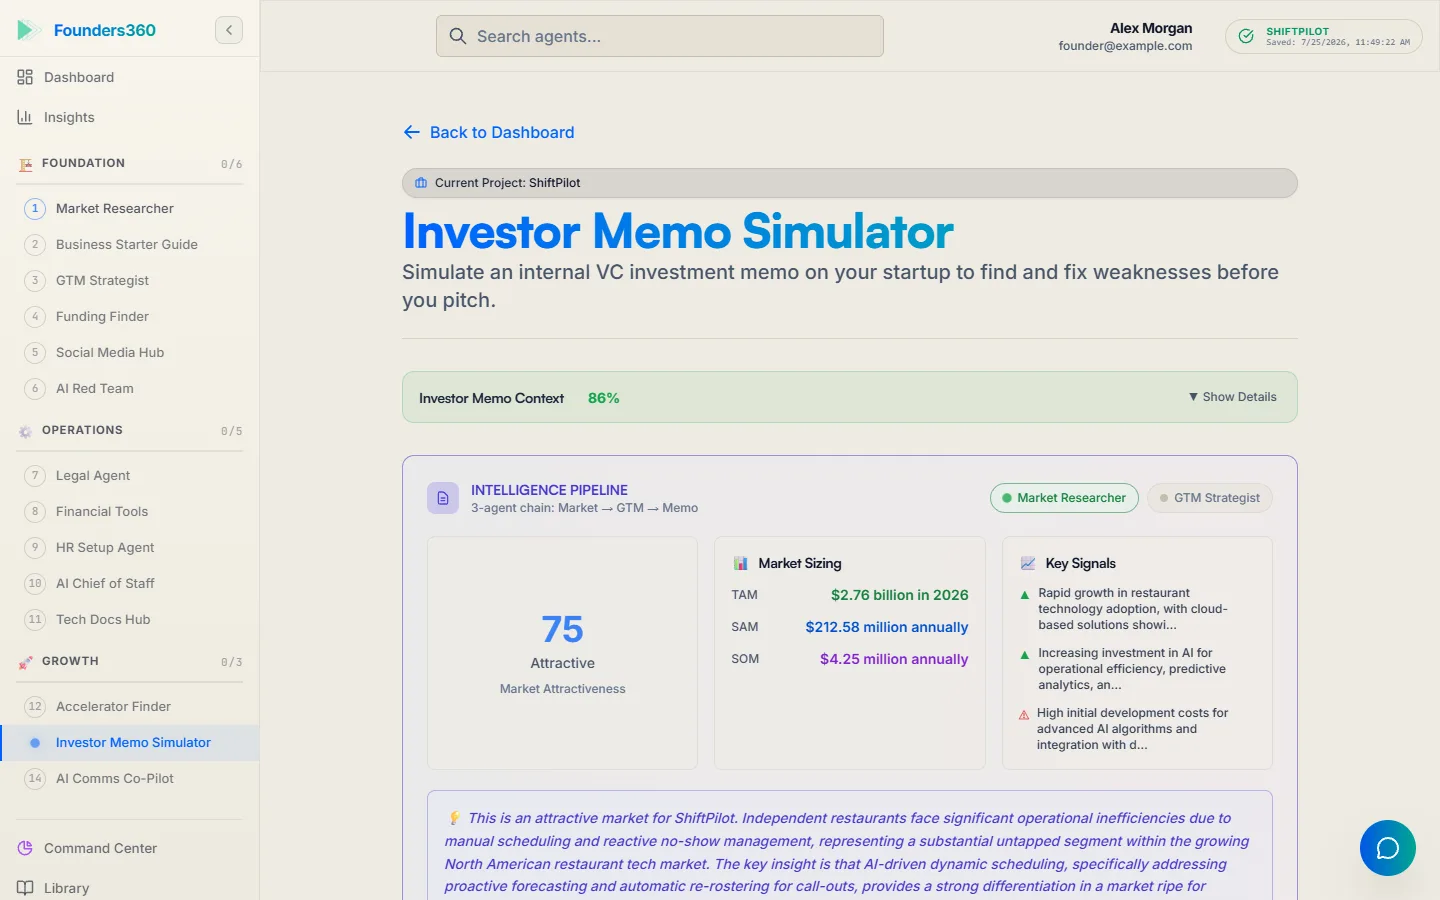
Founders360's Investor Memo Simulator helps with that last point by letting you see the round from the investor's side before the real meeting. Read our pre-seed fundraising guide for how valuation fits into the full process.
Frequently Asked Questions
Can a startup with no revenue have a valuation?
Yes. Investors price pre-revenue startups on team, product progress, market size and the competitive state of the round. The number is a negotiated judgment, supported by methods like Berkus and the scorecard, not a calculation from earnings.
What is a typical pre-revenue startup valuation?
It depends on sector, region, stage and year, so no single number is reliable. Carta's published data on SAFE caps gives a recent reference, and it showed medians around $10 million to $15 million for common pre-seed round sizes in 2025. Check the latest report before you rely on it.
Which valuation method should I use?
Use at least two. The Berkus or scorecard method gives a quick range for early companies, the venture capital method shows what an investor needs to believe, and market comparables check both against reality.
Is a valuation cap the same as a valuation?
No. A valuation cap is the ceiling price at which a SAFE converts to equity. It influences how much of the company the investor owns later, but the company is not formally priced until a priced round happens.
Should I pick the highest valuation I can get?
Not automatically. A very high valuation raises the bar for your next round and can lead to a flat or down round. Weigh price against terms, investor quality and the value of their help.
Tags
Related Articles
Term Sheet Explained: The Clauses Founders Must Understand Before Signing
A term sheet explained simply is a short, mostly non-binding offer that fixes the price and the control terms of a venture round. Most clauses are standard; a handful of economic and control terms decide who really wins.
7 min readFundraisingSAFE vs Convertible Note: Which Should Your Startup Use?
In a SAFE vs convertible note choice, the SAFE is simpler because it is not debt and has no interest or maturity date, while a note is a loan that converts into equity. This guide compares the terms side by side and shows when each one fits.
7 min readFundraisingHow to Write an Executive Summary for Investors (With Template)
To write an executive summary for investors, fit your problem, solution, market, traction, model, competition, team and ask on one page that a stranger can read in two minutes. This guide gives the order, a fill-in template and an illustrative example.
7 min readReady to Build Smarter?
Join thousands of solopreneurs using AI agents to scale their businesses.
Get Started Free